
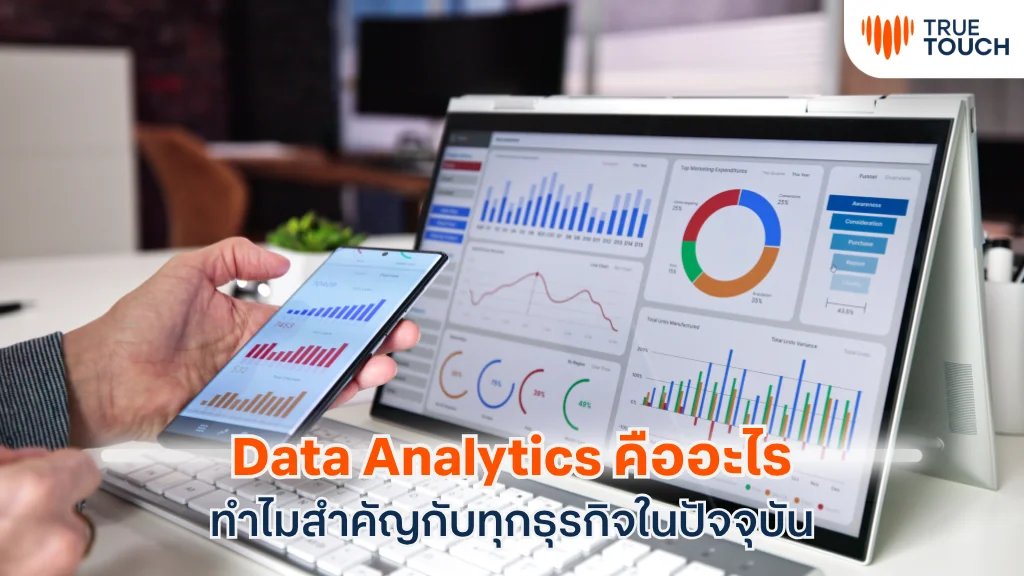
Data has become one of the most valuable assets in modern business. As organizations accelerate their Digital Transformation initiatives, they generate increasingly large volumes of information across customers, operations, sales, service, and digital channels.
Relying on intuition alone may no longer be sufficient for effective decision-making. Data Analytics enables organizations to transform raw information into meaningful insights that support more informed strategies, stronger operational performance, and sustainable business growth.
In this article, True Touch explores what Data Analytics is, how it works, and how organizations can apply analytics to improve business and customer service performance.
Data Analytics is the process of collecting, organizing, processing, and analyzing historical and current data from multiple sources to identify meaningful patterns, relationships, trends, and business insights.
Organizations can apply statistical techniques, analytical tools, and modern technologies to convert raw data into information that supports decision-making, strategy development, and targeted problem-solving.
The objective of Data Analytics is not simply to generate reports, but to turn data into actionable insights that can improve business outcomes.
Data Analytics can strengthen organizational capabilities and support better performance across several important areas.
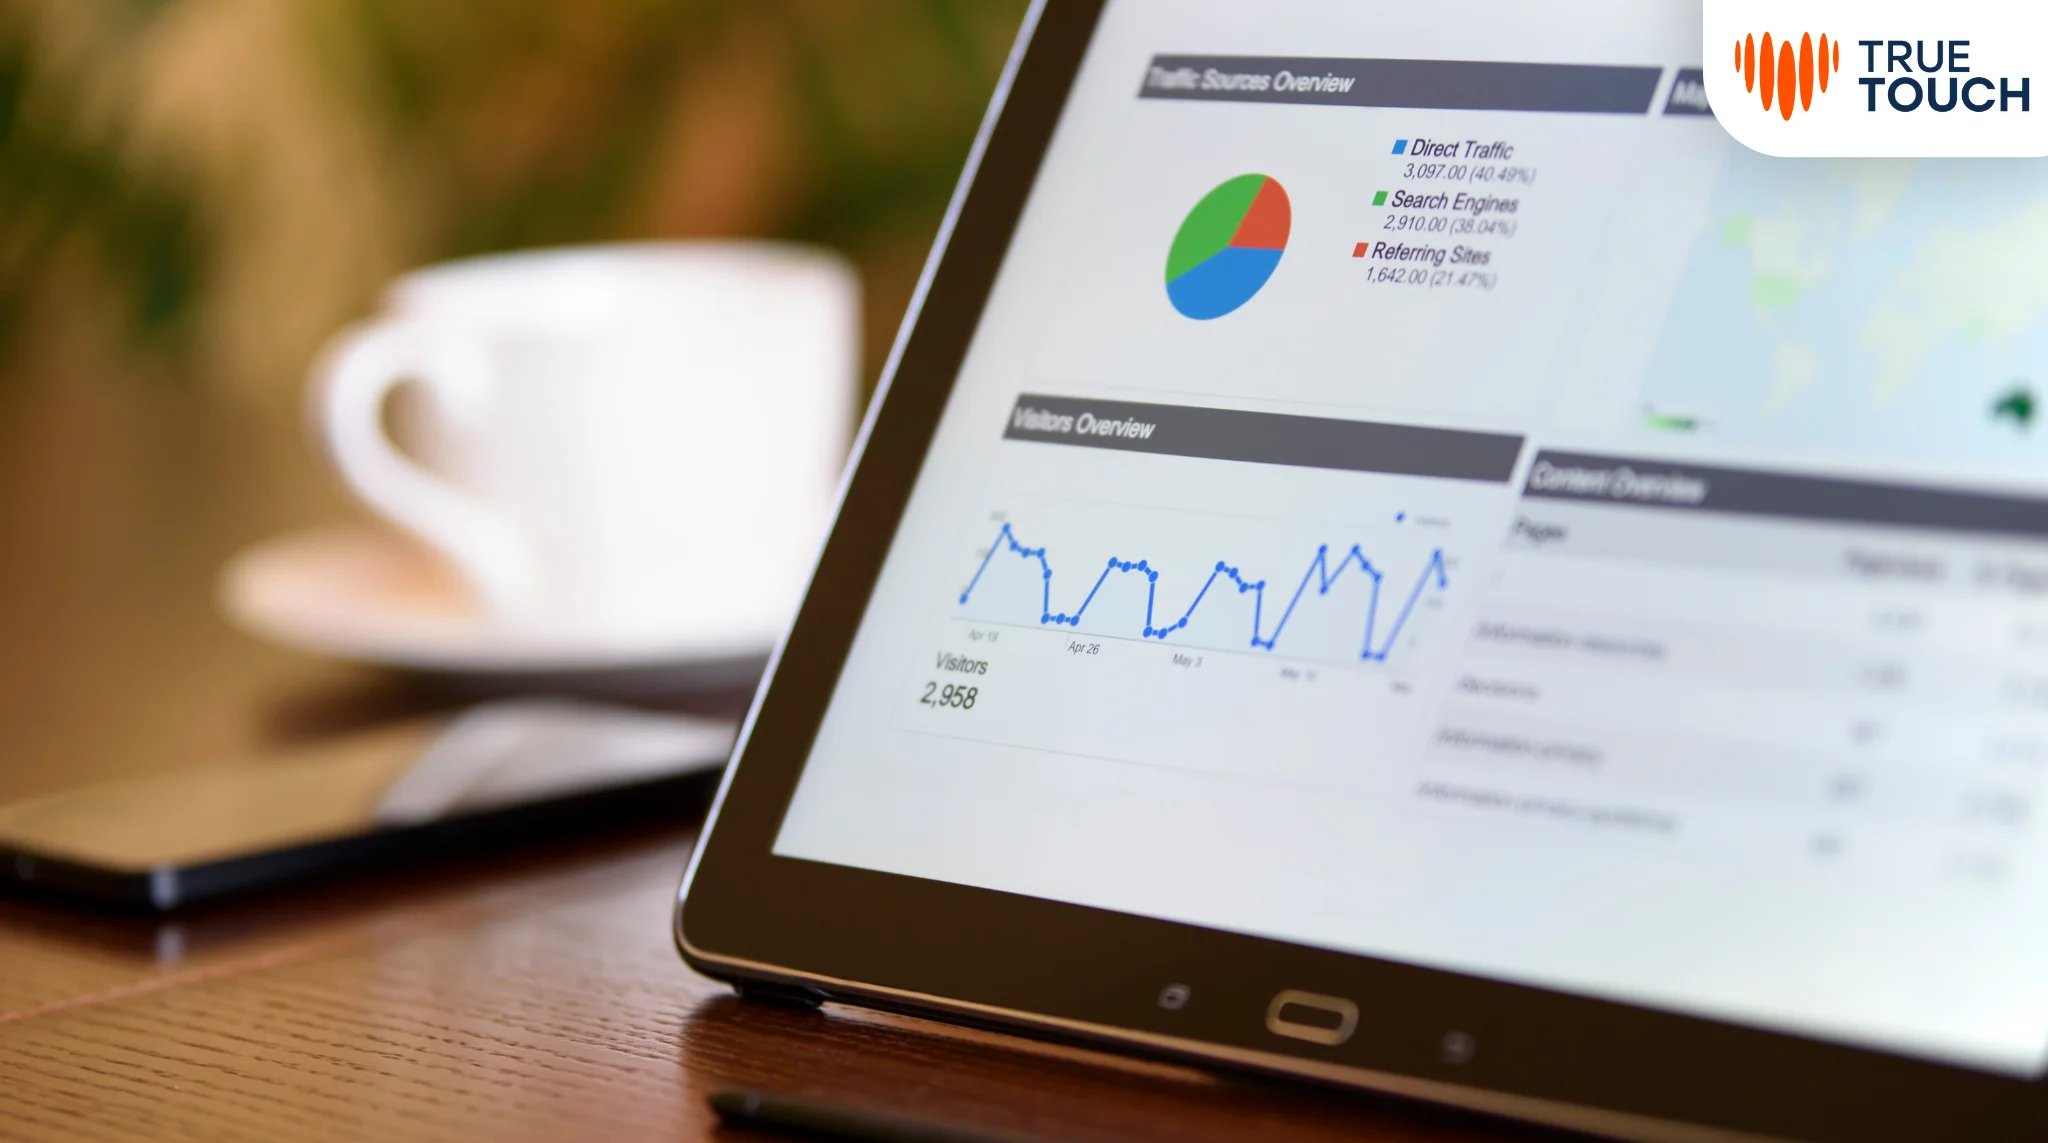
Data Analytics can generally be categorized into four major types according to the level of analysis and the business question being addressed.
Descriptive Analytics summarizes historical data to explain past performance.
Examples include monthly sales reports, website traffic summaries, Contact Center volumes, and service performance dashboards.
Diagnostic Analytics explores data in greater depth to identify possible causes behind a specific outcome.
For example, an organization may analyze why online sales declined or why customer complaints increased during a particular period.
Predictive Analytics uses historical data and analytical models to estimate possible future outcomes.
Examples include sales forecasting, customer demand prediction, Contact Center workload forecasting, and customer churn risk analysis.
Prescriptive Analytics evaluates potential options and recommends possible actions based on available data, business rules, or analytical models.
Examples may include recommending appropriate promotions, service actions, workforce allocation, or other next-best actions for different customer groups.
Although all three disciplines work with data, they differ in their primary objectives, analytical depth, and typical applications.
| Data Analytics | Data Science | Business Intelligence (BI) | |
| Primary Objective | Generate insights to answer business questions | Develop advanced models and predictive capabilities | Transform business data into accessible reports and dashboards |
| Typical Data | Structured and semi-structured business data | Large, diverse, and potentially complex datasets | Primarily enterprise and operational data |
| Common Tools | SQL, Power BI, Excel | Python, R, Machine Learning | Tableau, Power BI, BI platforms |
| Typical Output | Insights, trends, root-cause findings | Predictive models, algorithms, advanced analysis | Reports, dashboards, performance monitoring |
In practice, these disciplines often work together as part of a broader data ecosystem.
A structured analytics process helps organizations improve data quality and turn findings into practical business action.
1.Define the Business Objective
Begin by defining the business question, problem, or objective that the analysis needs to address.
Clear objectives help determine what information is required and which analytical approach should be used.
2. Collect Relevant Data
Gather data from relevant internal and external sources, such as CRM systems, operational platforms, sales records, Contact Centers, surveys, digital channels, or external datasets.
3. Clean and Prepare the Data
Identify and address duplicate, incomplete, inconsistent, or inaccurate records before analysis.
Reliable analytics depends significantly on the quality and consistency of the underlying data.
4. Analyze the Data
Select appropriate methods and techniques based on the business objective, ranging from basic statistical analysis to more advanced predictive approaches.
5. Communicate the Findings
Present results through clear reports, dashboards, and Data Visualization so stakeholders can understand patterns, trends, and business implications.
6. Turn Insights into Action
Translate analytical findings into specific improvement initiatives, decisions, or operational actions.
This is the stage where Data Analytics creates tangible business value.
The appropriate analytics tool depends on data complexity, user capability, business requirements, and technical environment.
Customer service generates significant volumes of valuable customer and operational data.
Applying Data Analytics to these interactions can help organizations identify service issues, improve workforce planning, and better understand customer behavior.
Contact Center interaction data can be analyzed to identify the most common reasons customers call or contact the organization.
For example, if a large number of customers repeatedly contact the organization for the same information, the business may improve website content, Self-Service capabilities, or communication processes to address the root cause.
This can help reduce avoidable contact volumes and improve operational efficiency.
Predictive Analytics can be used to estimate future interaction volumes based on historical patterns.
These insights can support workforce planning by helping organizations align staffing capacity with expected customer demand.
Customer purchase histories, service interactions, complaints, and engagement patterns can be analyzed to identify signals associated with potential customer churn.
Customer service or retention teams can then use these insights to prioritize appropriate follow-up or service recovery actions.
Technologies such as Natural Language Processing (NLP), Speech Analytics, and Auto QA can help organizations analyze larger volumes of customer conversations compared with traditional manual sampling alone.
These technologies can identify keywords, service topics, compliance indicators, and customer sentiment across voice and text interactions.
The resulting Voice of Customer insights can be used to strengthen Quality Assurance, coaching, and service improvement initiatives.

Organizations do not need to begin with a large-scale data transformation program.
A practical approach can include the following steps.
Technology alone does not create value unless teams understand how to interpret data and translate insights into action.
Applying Data Analytics to customer service operations can help organizations better understand customers, improve service quality, and make more informed operational decisions.
True Touch is ready to support organizations in strengthening customer service through data, technology, and professional service management.
By connecting customer data, service operations, and analytics, organizations can identify improvement opportunities, strengthen Customer Experience, and make better-informed decisions.
True Touch is ready to support businesses in transforming customer service data into actionable insights that drive operational efficiency and sustainable growth.
For more information, please contact:
Tel: +66 (0) 2088-8999
Email: [email protected]
Website: https://www.truetouch.co.th/en
Data Analysis generally refers to the process of examining and interpreting a specific dataset to answer a defined question or identify relevant patterns.
Data Analytics is a broader discipline that may include data collection, preparation, management, analysis, visualization, statistical techniques, and the use of technology to generate actionable business insights.
The two terms are often used interchangeably in practice, depending on organizational context.
Yes.
Modern analytics platforms increasingly offer Low-Code and No-Code capabilities, allowing business users to create reports, dashboards, and selected analytical workflows without advanced programming skills.
Tools such as Power BI, Tableau, and Looker Studio can support many business analytics use cases.
Organizations can also work with specialist service providers when more advanced data integration, analytics, or technical capabilities are required.
Organizations do not need to wait until they have large-scale Big Data environments.
Useful analysis can begin with smaller but reliable datasets such as monthly sales records, customer interaction histories, operational reports, or satisfaction survey results.
The quality, relevance, consistency, and completeness of the data are often more important than volume alone.
Data Analytics is not limited to people with degrees in Computer Science, Statistics, or Data Science.
Professionals from Business, Marketing, Finance, Operations, and other disciplines can develop analytics capabilities by strengthening skills in logical thinking, critical thinking, business understanding, data management, and Data Visualization.
Technical skills can then be developed according to the complexity of the role.
Data Analytics can transform customer interactions, complaints, and service data into actionable insights.
Organizations can use these insights to identify recurring customer issues, forecast Contact Center demand, improve workforce planning, analyze Voice of Customer trends, monitor service quality, and reduce friction across the customer journey.